
SYNTHESIS
How to profit over the long run, 20 to 50 years, via a low/no-cost access and risk-free, diversified portfolio?
This section focuses on what indicators provide causative signs of economic gains and retractions. With regards to securities selection (equities, bonds, commodities, others) the overarching goal is to access the markets when you have investable capital, rather than wait for the market to go down. Nonetheless, timing, in a medium-term sense, can be highly effective in reducing cost-basis and the insights on this website provide guidance as to when you might take advantage of that timing.
What to buy? Although in process, a portfolio approach to buying the economy can be found here.
Employment data is perhaps the most crucial indicator of economic health. Never has an unemployment rate figure that is low, and steadily rising, NOT indicated a recession. What is key here is the trend as opposed to absolute figures.
Buy public equities when unemployment rate is high, sell public equities when unemployment is low. This well-established relationship is demonstrated in the figure shown here.
When unemployment bottoms out and starts to rise then a recession, or economic slackening, begins. When initial jobless claims are beginning to raise (unemployment is increasing) then you have a recession on your hands. You want to sell public equities, as equities are generally at their height.
When unemployment is peaking, and cresting over, then a recession is over.
EMPLOYMENT
Employment data is perhaps the most crucial indicator of economic health. However, there are fundamental reasons why the rate is inaccurate. More detail can be found here on how the unemployment rate is calculated and issues with the method.
Data Sets
- Total Unemployment (graph)
- Average weekly hours, manufacturing (data / graph)
- Average weekly initial claims for unemployment insurance (here and here)
Total Unemployment analysis: U3 versus U6 versus Initial Claims
A dynamic chart can be found here.
- U3: what “everyone” refers to as the unemployment rate.
- U6: more comprehensive assessment of “full unemployment”.
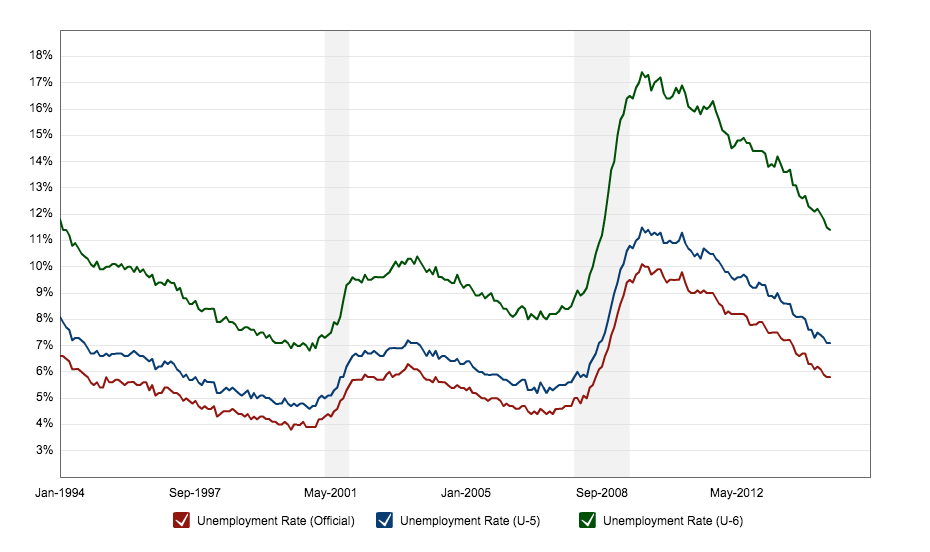
U3 (Official Unemployment); U5; and U6 Unemployment figures since 1994.
Average weekly initial claims for unemployment insurance (here and here)
Initial jobless claims, by definition, should be a leading indicator for overall unemployment rate. Initial claims worked as a very telling sign in 2000 tech-wreck, and did not occur as a leading unemployment in 2009 great recession. Both are shown below.

2000 Tech-Wreck: Initial jobless claims and ISM Employment Index show nicely the leading indicator of overall employment.
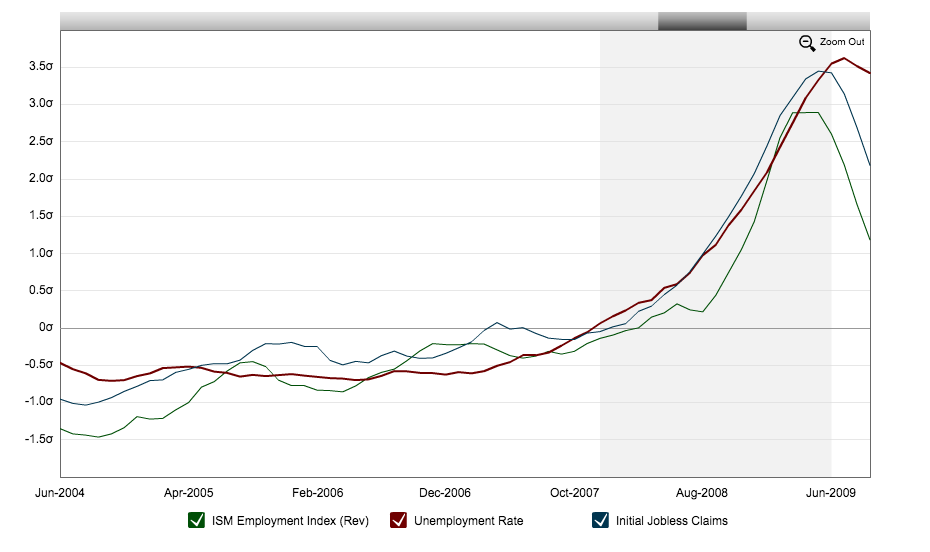
2009 Great Recession: A number of false peaks via Initial Jobless Claims…until actual unemployment rises ahead of initial claims.
Average weekly hours, manufacturing (data / graph)
If average workweek drops out of 34.4 to 34.7 band, the deviation portends trouble.
VALUATION & PRICE/EARNINGS RATIOS
Current P/E data here.
Fundamental performance is generally accepted as best approximated by earnings per share (EPS). Valuation, defined by price per share. Price to Earnings Rate (P/E) combines these two factors to assess valuation per fundamental performance.
To realize buy low, sell high…the pursuit is to acquire public equities at a price lower than the long-run averages of public equities. Then, to realize gains by selling same public equities when valuation at fundamental performance is above the long-run average.
P/E ratios in last 25 years are 15.7x (forward P/E, S&P500). You want to look at forward price/earnings as market is anticipating the future by discounting and pricing in expectations. Of note, P/E ratios tend to overshoot on the high side, and underswing on recessions.
Additionally, economic lessons from the stock market can be found here.
