
ECONOMIC INDICATORS
EMPLOYMENT
Employment data is perhaps the most crucial indicator of economic health. Never has an unemployment rate figure that is low, and steadily rising, NOT indicated a recession.
- Total Unemployment (graph)
- Average weekly hours, manufacturing (data / graph)
- Average weekly initial claims for unemployment insurance (long-term graph and most recent press release)
- Job Openings & Labor Turnover Survey (JOLTS) – homepage, graph)
- Avg. Hourly and Weekly Earnings of Production & Nonsupervisory Workers (data)
- Wages (overall and manufacturing)
- Segmentation analysis:
- Male “bread-winner” with spouse present: demographic is highly motivated to seek work.
- Single-mothers: also highly motivated to find work.
- Labor Force Participation Rate (graph)
LEADING INDICATORS
Leading Indicators are an effective means to identify when public equities portend a significant downswing. When LEI starts to drop down and fall, start to watch with a focused approach. When Coincident Economic Indicators start to fall down, public equities are expected to follow.
Ironically, the Conference Board’s Index of Leading Economic Indicators (LEI) really isn’t leading data. Upon release, the data is almost two months old, and most of the 10 component reports have been released prior to the LEI itself. It purports not to signal a change in market direction until the index has moved in the same direction, up or down, for three consecutive months, which it rarely does. It is widely viewed as a better harbinger of recession than expansion. However, it has predicted a number of recessions that did not occur, suggesting that “economists have correctly predicted nine of the last five recessions.”
Leading Indicators Index is put out by the Conference Board, and latest indicators can be found here. Details of each of the ten (10) elements of Leading Economic Indicators (LEI) are listed after the jump.

Leading Economic Indicators Component Elements
- Average weekly hours, manufacturing (data / graph)
- Average weekly initial claims for unemployment insurance (here and here)
- Manufacturers’ new orders, consumer goods and materials
- ISM® Index of New Orders (data / graph)
- Manufacturers’ new orders, nondefense capital goods excluding aircraft orders (graph)
- Building permits, new private housing units (graph)
- Stock prices, 500 common stocks (graph)
- Leading Credit Index (data and graph)
- Interest rate spread, 10-year Treasury bonds less federal funds
- Average consumer expectations for business conditions
The Jobless Claims Report, is a report released weekly by the Department of Labor. In a weakening economy, unemployment filings will trend upward. They are generally analyzed as a four-week moving average, in order to smooth week-to-week variance. However, this report has a built-in bias in that self-employed persons, part-timers and contract employees who lose their jobs don’t qualify for benefits and thus are not counted.
M2 Money Supply is a technical calculation of how much money is moving around in the economy is released by the Federal Reserve. An upward trend suggests inflation. However, in a digital world in which vast sums of money can be transmitted across the globe in an instant, this indicator has lost much of its importance over the last decade.
A compendium of indicators can be found here, on right hand side.
Current Account as Leading Indicator for International vs. US Stock performance
All else equal, global equities performance can be projected/forecast by geography and stage of development (emerging, frontier, developed) of a country/region.
One indicator that has a solid track record of signaling when international stocks may outperform or underperform relative to U.S. stocks is the ‘current account.’
The current account is driven by trade and money flows in and out of the United States. Since the early 1970’s, when oil and interest rates started to impact US and international economies, the “current account rate” has offered a medium-term (4-8 year) trend indicator for relative US vs. International equities performance. Current account rate is U.S. current account as a percentage of GDP.
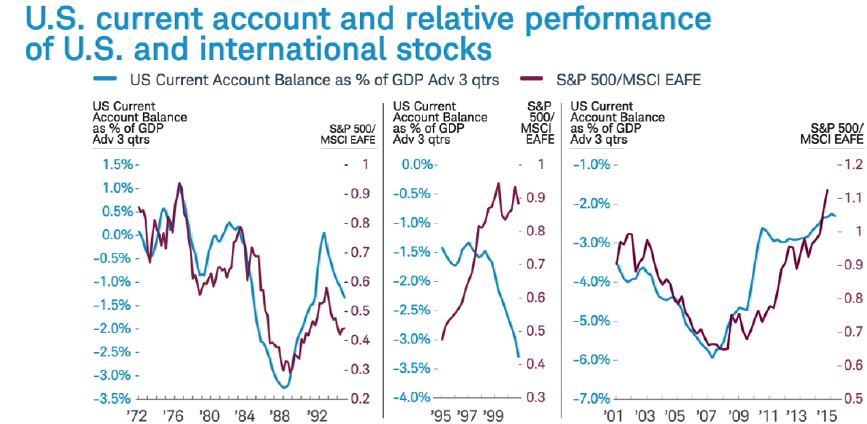
Charles Schwab; Bloomberg data
Over the past 42 years, when the U.S. current account as a percentage of GDP was improving, U.S. stocks outperformed international stocks. The opposite was true when the current account worsened: international stocks outperformed U.S. stocks. Time lag of about three quarters exists: upward and downward trend changes in the current account led to relative stock market performance about three quarters later.
The only exception to this long term trend was 1995 to 2000 when the U.S. current account deteriorated yet U.S. stocks outperformed international stocks. A feature unique to this time period was the technology stock bubble and the associated US equity run-up to the millennia. Other than this exigent period of five years, the indicator has performed consistently in a variety of economic environments over the past 40 years.
Hypothesis: Current account rate will continue to inform relative performance of US vs. International equities, on a medium-term horizon.
If this hypothesis is valid, what are indicators? Between July and Oct, 2014 the U.S. current account rate has flattened. This recent flattening has occurred after steady improvement since 2007. While early in the +3 quarter lead as an equity indicator, a change in trend could be occurring now. A key to the direction in 2015 may be the dollar. The US dollar is expected to continue to rise relative to international currencies. If the U.S. current account rate were to deteriorate driven by an ongoing and significant rise in the U.S. dollar, it would suggest that international stocks may finally begin to outperform U.S. stocks in 2015.
Segmenting non-US equities markets, emerging market stocks historically have outperformed their developed country counterparts when global exports improve. Over the past 10 years, when global exports grew faster than 2.5% in a quarter, returns from emerging market stocks almost doubled those of international developed country stocks. Of note, this trend may be too short of a time period to measure long term cause and effect.
Yield Curve
Inverted Yield Curve Portending Recession
Interactive Yield Curve here.
Why does an inverted yield curve signal a major peak for the stock market? Because every U.S. recession over the past 50 years was preceded by the Fed hiking rates enough to invert the yield curve. Seven out of seven times. Generally an inversion of 0.5% is the break-point for an inverted yield curve to exist. For example, the S&P 500 Index peaked in 2000 and 2007, when the 3month to 10year yield curve was inverted by about 0.5%. History shows that bull markets end and bear markets begin when the Fed pushed short-term rates above long-term rates by 0.5% or greater. This is referred to as ‘inverting the yield curve.’ As the economy goes, so does the equities market – albeit equities act as a leading indicator itself on economic performance.
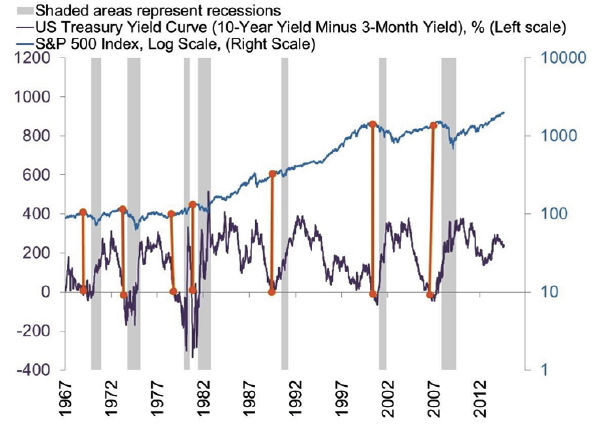
Charles Schwab, FactSet, Bloomberg data
Timing. The yield curve inversion usually takes place about 12 months before the start of the recession, but the lead-time ranges from about 5 to 16 months. The peak in the stock market comes around the time of the yield curve inversion, ahead of both the recession and accompanying downturn in corporate profits. As it is hard for the rest of the world not to suffer when the U.S. economy slides into recession, the U.S. yield curve is an important global indicator.
How far the Fed must push up short-term rates before the yield curve inverts by 0.5% depends on large part on where long-term rates are. Even if long-term rates stay at the very low yield of 2.2% seen at the end of 2014, to invert the yield curve by 0.5% the Fed would need to hike rates from around zero to more than 2.5%. Based on the latest survey of current Fed members who vote on rate hikes, they do not expect to raise rates above 2.5% until the end of 2016, at the earliest. The facts suggest the best indicator for the start of a bear market and global recession may still be a long way from signaling a cause for concern.
SENTIMENT INDICATORS
- Univ. of Michigan Consumer Sentiment (graph)
- Consumer Confidence (most recent press release)
MARKETS INDICATORS
PUBLIC EQUITIES
Funds Flows provide an indicator of capitulation – when the market has hit a bottom or is near a bottom. As well, when the market is peaking and momentum building into a bubble or other outsized non-sustainable returns.
When the market is going down it is useful to have a sign of bottoming-out. This, to avoid (as much as possible) effect of trying to catch a falling knife as the market swoons and dips on its way to a bottom.
In general, “funds flow” out from ETFs and mutual funds, on a statistically larger basis than funds flow that has contributed to the then-current falling prices, indicates capitulation and a bottoming of the markets.
In up-markets, an overshoot of funds flow tends to exist as fast followers and dumb money tends to move into the markets after significant dollars have attributed to the rise…cresting of public equities typically occurs after large allocations into markets. However, this depends greatly on current situations. What is large? A statistically larger basis of funds flow that has contributed to the then-current rise in prices.
- ETF Funds Flow indicators (SPY, R2K, DIA, others)
- Mutual Funds Flow
NON-ECONOMIC INDICATORS
Here are non-economic indicators that show leading and lagging performance data.
- Railcar Shipping Volume and Pricing (here) and why it is important
- Transportation Services Index (here)… In the past 30 years, whenever freight TSI has hit a peak and turned downward, a recession or growth slowdown has followed.
- FEDEX Shipping Volume (quarterly stat book) & FEDEX Economic Forecast. Note, FEDEX Q4 is Feb-May; year-end is 31 May.
- Baltic Dry Index (global shipping rates)…overview of Baltic Dry Index below.
- West Texas Intermediate (WTI) Crude Oil Prices (USD/barrel)
- Commodity Prices (all)
Overview of Baltic Dry Index
The Baltic Dry Index (BDI) is a measure of what it costs to ship raw materials— iron ore, steel, cement, coal and so on—around the world. The Baltic Dry Index is compiled daily by The Baltic Exchange. To compile the index, members of the Baltic Exchange call dry bulk shippers around the world to see what their prices are for 22 different shipping routes around the globe. Once they have obtained these numbers, they compile them and find an average. To ensure they are getting a comprehensive view of the entire shipping industry when looking at various shipping costs, the Baltic Exchange looks at costs for each of the following four sizes of ships:
- Capemax (10 percent of the global fleet): ships that can carry 100,000+ dead weight tons of cargo and are too big to pass through the Panama Canal
- Panamax (19 percent of the global fleet): ships that can carry 60,000-80,000 dead weight tons of cargo and can barely fit through the Panama Canal
- Handymax, or Supramax (37 percent of the global fleet): ships that can carry 45,000-59,000 dead weight tons of cargo
- Handysize (34 percent of the global fleet): ships that can carry 15,000-35,000 dead weight tons of cargo
Why Investors Watch the Baltic Dry Index
The Baltic Dry Index is a leading indicator that provides a clear view into the global demand for commodities and raw materials. The fact that the Baltic Dry Index focuses on raw materials is important because demand for raw materials provides a glimpse into the future. Producers buy raw materials when they want to start building more finished goods and infrastructure—automobiles, heavy machinery, roads, buildings and so on. Producers stop buying raw materials when they have excess inventory and when they stop infrastructure projects.
Typically, demand for commodities and raw goods increases when global economies are growing. For investors, knowing when the global economy is growing is helpful because that means stock prices, commodity prices and the value of commodity-based currencies should be increasing. Conversely, demand for commodities and raw goods decreases when global economies are stalling or contracting. For investors, knowing when the global economy is contracting is helpful because that means stock prices, commodity prices and the value of commodity-based currencies should be decreasing.
The Baltic Dry Index is also a compelling indicator because it is a simple, real-time indicator that is difficult to manipulate. Some economic indicators—like unemployment rates, inflation indexes and oil prices—can be difficult to interpret because they can be manipulated or influenced by governments, speculators and other key players. The Baltic Dry Index, on the other hand, is difficult to manipulate because it is driven by clear forces of supply and demand.
The supply that affects the Baltic Dry Index is the supply of ships available to move materials around the globe. It is difficult to manipulate or distort this supply because it takes years to build a new ship that could be put into service to increase supply, and it would cost far too much to leave ships empty in an attempt to decrease supply. The demand that affects the Baltic Dry Index is the demand of commodity buyers who need the raw goods for production. It is difficult to manipulate or distort demand because it is calculated solely by those who have placed orders to have raw goods shipped. Nobody is going to pay to book a Capemax cargo ship who isn’t actually going to use it.
However, other factors contribute to price to ship commodities. The largest of which is the price of oil.
Interpreting the Baltic Dry Index
The Baltic Dry Index typically increases in value as demand for commodities and raw goods increases and decreases in value as demand for commodities and raw goods decreases.
Here’s what it typically means when the Baltic Dry Index turns around and starts moving UP:
- Global economies are starting to, or continuing to, grow
- Companies are starting to, or continuing to, grow
- Stock prices should start to, or continue to, increase in value
- Commodity prices should start to, or continue to, increase in value
- The value of commodity currencies—like the Canadian dollar (CAD), the Australian dollar (AUD) and the New Zealand dollar (NZD)—should start to, or continue to, increase in value
Here’s what it typically means when the Baltic Dry Index turns around and starts moving DOWN:
- Global economies are starting to, or continuing to, contract
- Companies are starting to, or continuing to, contract
- Stock prices should start to, or continue to, decrease in value
- Commodity prices should start to, or continue to, decrease in value
- The value of commodity currencies—like the Canadian dollar (CAD), the Australian dollar (AUD) and the New Zealand dollar (NZD)—should start to, or continue to, decrease in value
Transportation Services Index
The Transportation Services Index is a measure of the monthly output of the transportation sector of the US economy. Output? For the freight sector, we use ton-miles of freight, or we use tons when we can’t get ton-miles. For passenger modes, we use passenger-miles or passengers, depending on what we can get. We collect the data and then we seasonally-adjust it.
Why is this useful? Shipment volumes of raw materials, especially coal and petroleum, often change before changes in sales and production. That means the freight index tends to change direction before the economy does. In the past 30 years, whenever freight TSI has hit a peak and turned downward, a recession or growth slowdown has followed.
